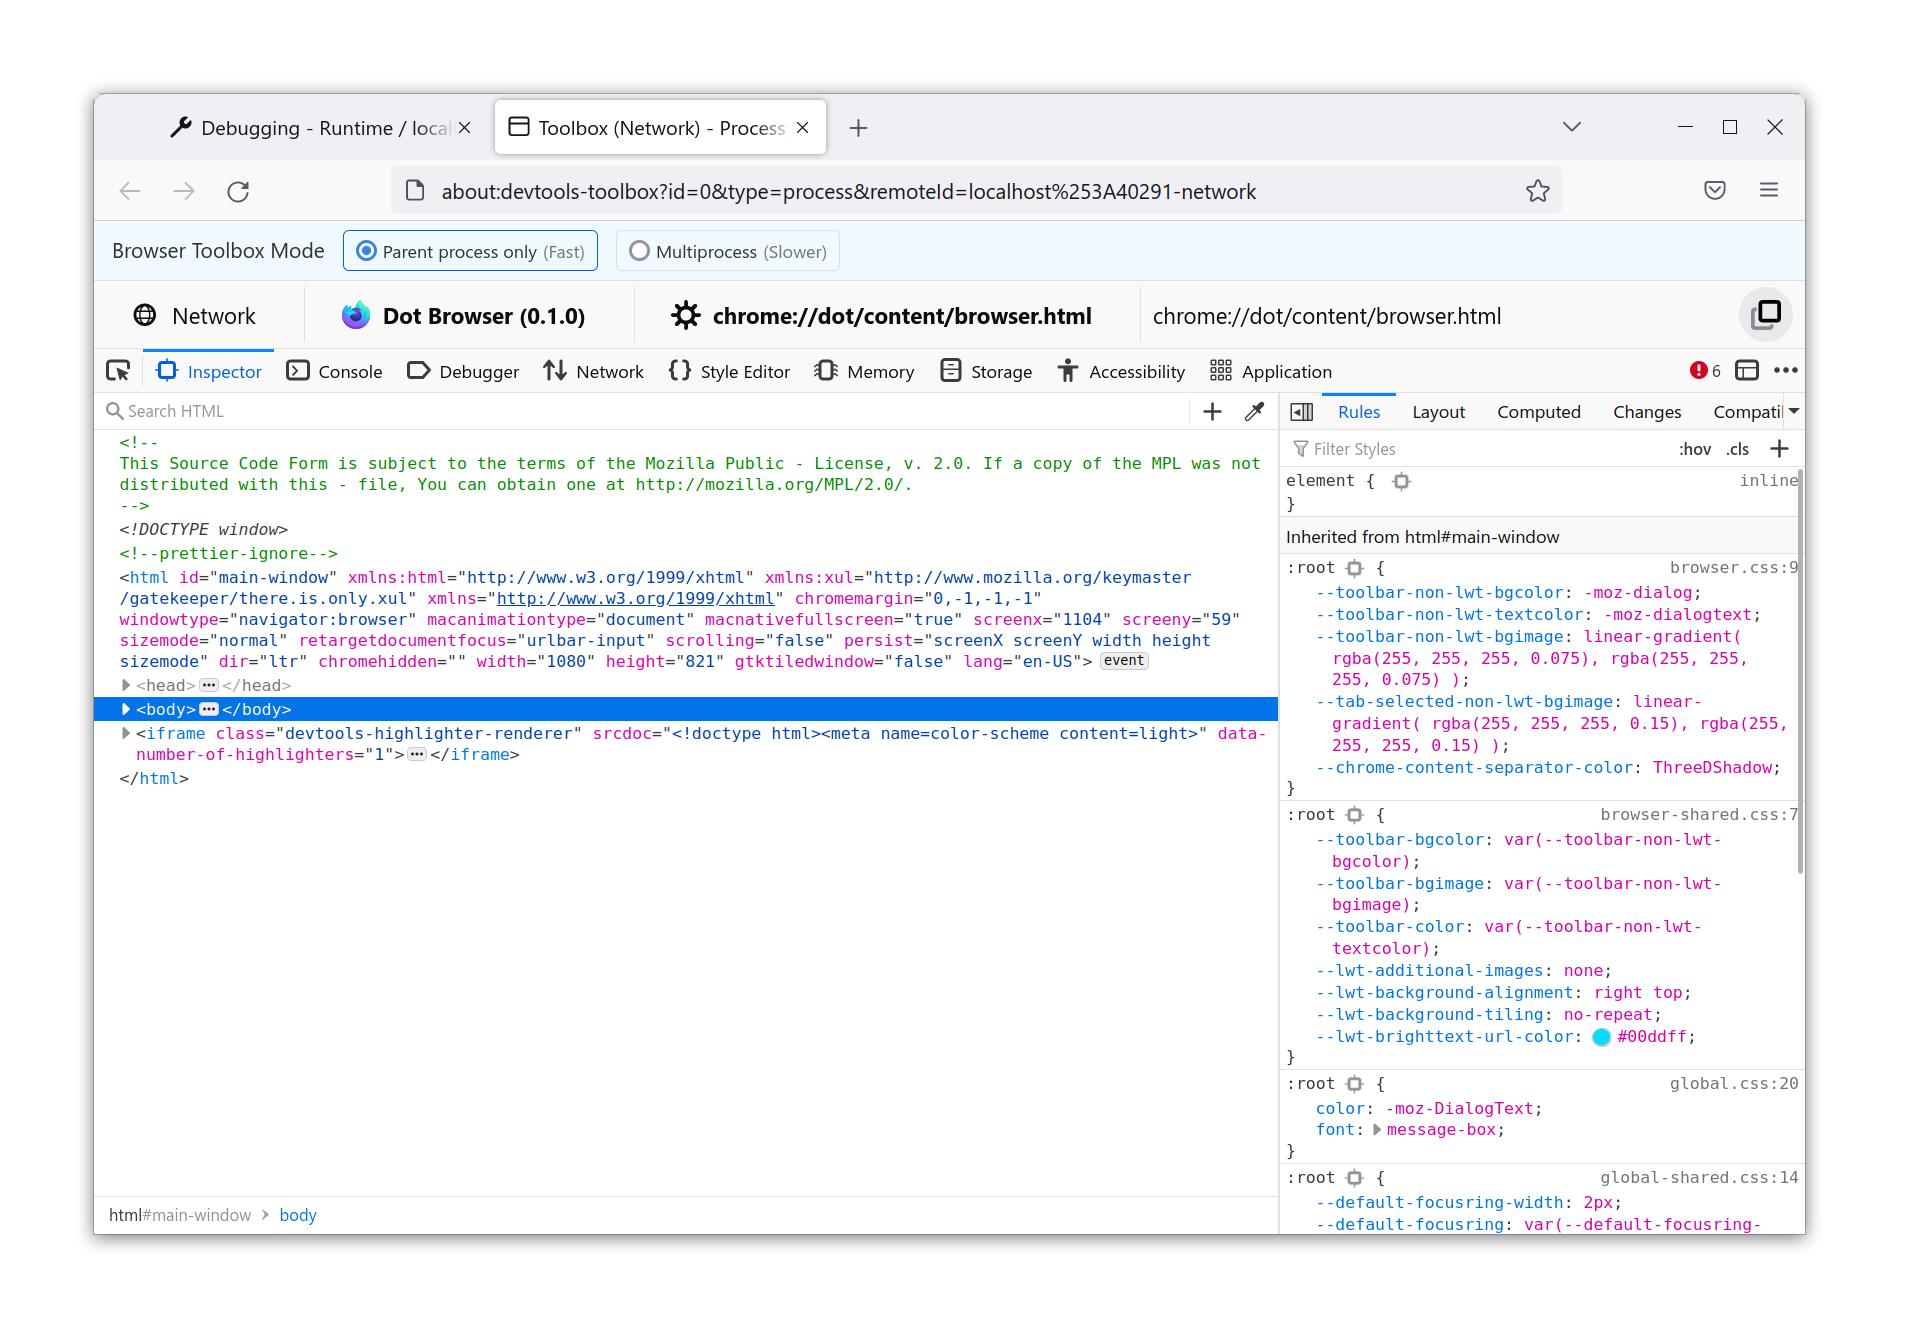
The Browser DevTools
Dot Browser exposes some APIs when in non-release mode in order to debug and see the internals of the browser.
Notes
The Browser DevTools cannot be used in a release build of Dot. This is due to security risks with exposing these APIs for any program on your computer to access. You will know if Dot Browser has been built in release mode if the MOZILLA_OFFICIAL=1 option is set in your mozconfig.
How to use
Launch Dot Browser using ./mach run. Once launched, you should see a message similar to in the logs. Keep note the port number displayed.
0:02.70 /home/user/browser/obj-x86_64-pc-linux-gnu/dist/bin/dot
DevTools server started on port 40291.
In this instance the port number is 40291.
Now start by launching Mozilla Firefox (we recommend Nightly or the Developer Edition, but Stable works fine).
Next, navigate to about:debugging in the address bar.
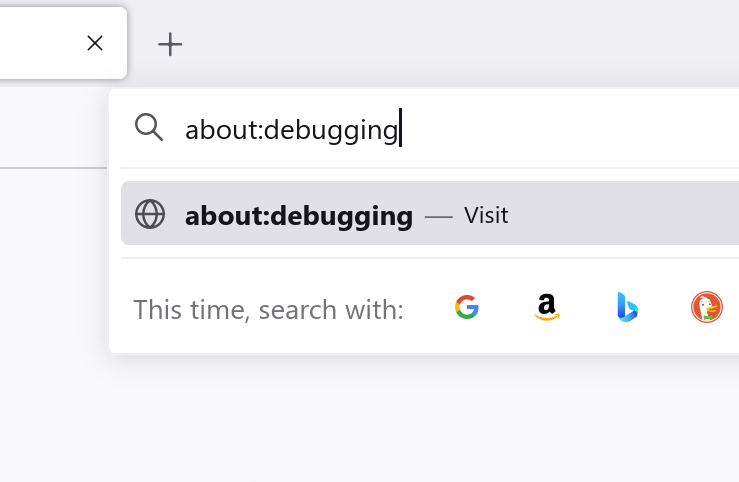
Once the page loads, scroll down to the Network Location on the Setup screen.
In the Host box, type in the local address of the DevTools server launched by Dot Browser.
It will be in the format of localhost:[port from earlier], for example: localhost:40291.
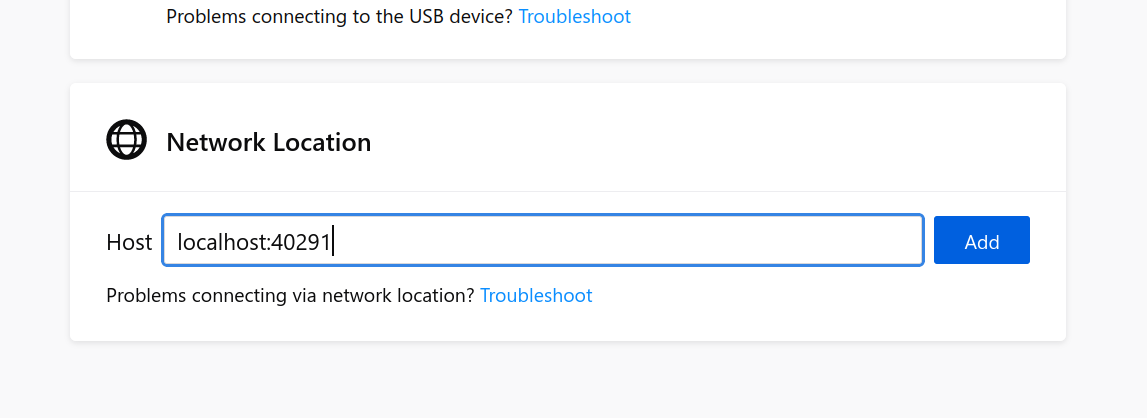
Click Add and you should now see the network location we just added in the sidebar.
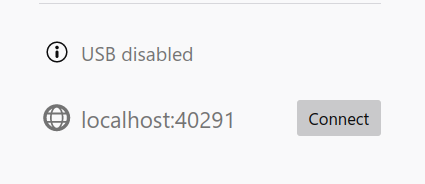
Now, click Connect next to the network location and if everything is sucessful connecting to the browser process, you should see the following screen:
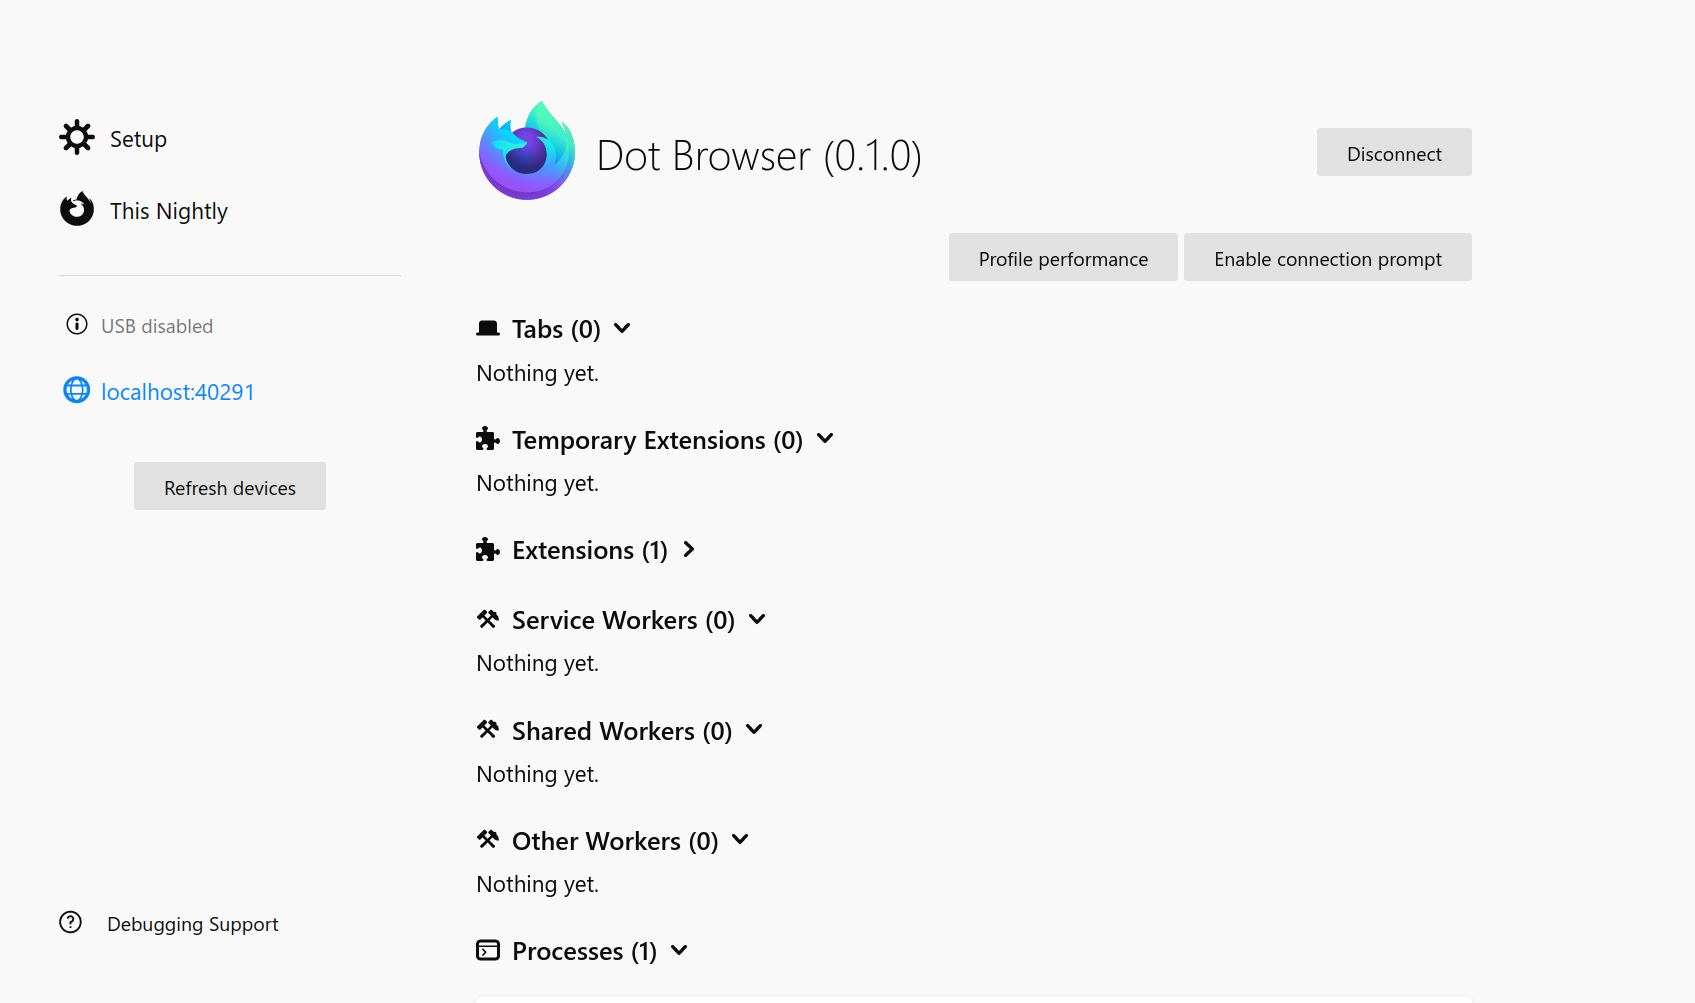
Then scroll right to the bottom until you see the Processes section. Once you see a Multiprocess Toolbox entry, click Inspect to bring up the Dot Browser Multiprocess Toolbox.

A new tab should then open with the Browser Toolbox page. You have successfully connected to Dot Browser's Browser DevTools. Feel free to hack away and modify, these tools are your friend!
